Guide to Advancing Hurricane Science by Laying on Your Couch

Atmospheric Sciences Seminar Series
Thursday, February 22, 2018
12:30 PM, ASAC 319

Ever since Lord Chesterfield developed the first modern couch during The Restoration, generations of comfort seeking global citizens have taken advantage of its soothing support, interrupted only for work or the occasional trip to the loo.  Now, as society accelerates into the Information Age, a new activity for exercise-challenged individuals presents a rare opportunity to advance science while indulging in spirits and burning less than 1 calorie per hour.

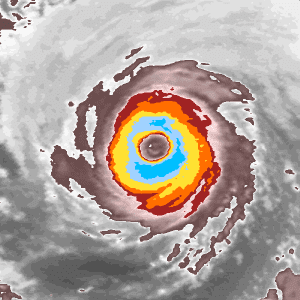
Inspired by the legions of couch potatoes who have explored the mysteries of the galaxies through the crowdsourcing website Galaxy Zoo, Cyclone Center was introduced to the world in September of 2012.  Harnessing the pent-up energy of Netflix binge-watchers everywhere, Cyclone Center uses crowdsourcing to generate unique data used to determine the intensity of any tropical cyclone. Cyclone Center output brings order to the chaotic scene of global tropical cyclone intensity records, where individual forecast agencies desperately grope around in the darkness for ground truth data that do not exist.

Dr. Christopher C. Hennon

Dr. Chris Hennon is a Professor and Chair of the Department of Atmospheric Sciences at the University of North Carolina at Asheville. Before beginning his position there in 2005, he was a Post-Doctoral Fellow and Visiting Scientist at the National Hurricane Center in Miami, FL where he conducted research on evaluating the impact of scatterometer winds on marine and tropical cyclone forecast skill. Dr. Hennon earned his B.S. in Aeronautics/Mathematics from Miami University (OH) in 1994, his M.S. in Atmospheric Science from Purdue University (1996), and his Ph.D. from The Ohio State University (2003). He was born and raised near Cleveland, OH and maintains his allegiance to the Cleveland Browns to this day. Dr. Hennon is married to another meteorologist but their 15-year old daughter has no interest in weather and just uses her phone all day.

Groundhog Day 2018

Every February 2, thousands gather at Gobbler’s Knob in Punxsutawney, Pennsylvania, to see the spring forecast from a special groundhog. In 2018, Punxsutawney Phil saw his shadow. We have six more weeks of winter!

Groundhog Day History

During the Middle Ages, various Europeans thought that animals hibernating underground such as the hedgehog and badger came to the surface on February 2. According to the Punxsutawney Groundhog Club, the observance may have its roots in Candlemas Day, which is also on February 2. Candlemas marks the halfway point between the winter solstice in December and the spring (vernal) equinox in March.

Earth’s orbit. February 2 lies halfway between the Winter Solstice and the Vernal (Spring) Equinox.

In Germany, it was thought that if the hedgehog saw its shadow it became frightened and crawled back to sleep during six more weeks of bad weather above ground. But if skies were cloudy, the animal ventured out and stayed above ground. When Germans emigrated to America, they transferred their belief to the animal most closely resembling the badger — the groundhog.

Predicting the Arrival of Spring is Difficult

Since at least the 1970s, as the New York Times reported, the groundhog’s predictive skill has been called “dubious” by the Audubon Society, and by the late Eric Sloane as “a full‐fledged F”, when ranking groundhog predictions on a scale from T (True) to P (Possible) to F (False). The most recent years of an analysis by NOAA’s National Centers for Environmental Information (NCEI) shows no accuracy for the groundhog’s predictive skill. From 2007-2016, Punxsutawney Phil has been right 50% of the time:

Verification of Punxsutawney Phil’s prediction and the observed

Warmer Temperatures Typically Observed after Groundhog Day

While the groundhog doesn’t exhibit predictive skill on Groundhog Day, we do know that most locations in the U.S. show observed warming trends for the 6 weeks after Groundhog Day. Climate Central examined the trend in the temperature by determing the average temperature from February 2 through March 16 from the Applied Climate Information System at www.rcc-acis.org. They found most locations across the U.S. showed an increasing temperature trend since 1950.

For example, in St. Johnsbury, Vermont, there has been an increasing average temperature trend from February 2 to March 16.

the very warm February.

Earlier spring may sound nice at first, but it comes with an increased risk to agriculture. In Vermont, this is particularly applicable to maple syrup (Vermont has the highest percentage of tapped maple trees in the U.S.) As Climate Central notes, “maple syrup production is intimately tied to the weather. Sap only flows when temperatures rise above freezing during the day and drop below it during the night. That temperature difference creates enough pressure to push sap out of the tree — one of nature’s amazing feats.” Timothy Perkins, the director of the University of Vermont’s Proctor Maple Research Center, says, “in general over New York and New England, the [maple sugaring] season is now beginning about seven days earlier than it did 40-50 years ago and ending 10 days earlier.” 

Sap buckets on Corey Hill in Putney, VT