

This page provides a quick reference on how to get started with AWIPS. We plan to incorporate additional “AWIPS Applications Modules” that are not intended to replace concepts learned in the classroom (including courses such as: Dynamics, Remote Sensing, and Analysis & Forecasting), but rather as additional reference material to facilitate the application of these concepts using real-world, real-time observations, remote sensing, and model data. As of April 2019, NVU-Lyndon Atmospheric Sciences is using Unidata’s customized version of AWIPS build 18.1.1.
Table Of Contents
- Getting Started (how to open AWIPS, and set server name)
- Product Availability
- What is the “Resource Stack”?
- Toggle to Two- and Four-Panel Layouts and Sampling Loaded Resources
- Hold-Right-Click Resource for Menu
- Time Match Basis
- How to take a screenshot in Linux
Getting Started
The user side of AWIPS (the Advanced Weather Interactive Processing System) is called CAVE, the Common AWIPS Visualization Environment. The acronyms AWIPS and CAVE may be used interchangeably or together. They are usually referring to the same user interface. While AWIPS CAVE is installed on Windows in ASAC 315 and the Weather Center, the latest version, including support for new GOES-16 and GOES-17 data, is only available on Linux.
After logging into Linux, start CAVE from the menu Applications > Internet > AWIPS CAVE. Alternatively, you can start CAVE from the command line (Terminal), by typing: cave and pressing the Enter key.

Enter EDEX Server
If prompted, enter an EDEX server name, for example: edex-cloud.unidata.ucar.edu, and type BTV for the site. Click Start CAVE.

| EDEX Server | Available Data |
| edex-cloud.unidata.ucar.edu | Most models, satellite, radar reflectivity & velocity |
| omega | Everything available on Unidata cloud EDEX plus: MRMS composite reflectivity mosaic, 0.5° tilt dual-pol products (ZDR, CC, KDP, HC) |
Maximizing display space is essential in AWIPS for many different windows, including CAVE. One tip is to use the maximize button in the upper-right part of the window to expand the window to fill the monitor.


Product Availability
The Models menu has numerous ways of loading and displaying model data. Model data is a unique data type in AWIPS because it supports displaying data as both graphics (e.g. contours) and images (color-filled layers).
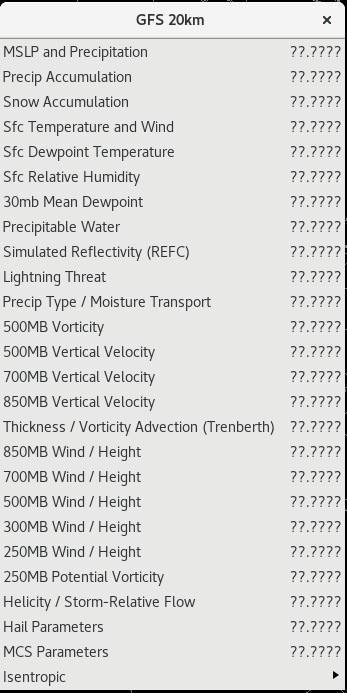
Clicking on a model name (e.g. GFS20) in the Models menu opens a list of built-in products containing standard forecast parameters like 500mb height and vorticity and mean sea-level pressure. Click the line of dashes along the top of the menu to “tear” the menu off. As data is inventoried, it will display question marks next to each line. If data is available, the following date/time format is used: DD:HHMM where DD is the date, and HHMM is the hour and minute (in Zulu time) valid for the latest received model run (or latest available time for realtime data). If no data is available, you’ll see –:—-
Resource Stack
At bottom-right of the map window is the Resource Stack, which displays all loaded resources and map overlays, and allows for interaction and customization with the resource via a right-click menu.
There are three available views of the Resource Stack, the default will show all Product Resources. Right Click the mouse on the map background to switch to a Simple View. Right Click again to show all Map Resources. Right Click again to toggle back to Product Resources.
It’s important to understand that Product Resources and Map Resources are handled differently given the time-based nature of Products, compared to the static nature of maps. Selecting the Clear button will remove all Products but not remove any Map Products.
A left click on any resource in the stack will hide the resource and turn the label gray. Clicking the name again makes the resource visible.

Hold-Right-Click Background for Display Menu
Holding down the right mouse button anywhere in the map view will open a right-click menu. This menu allows you to change the panel layout, or enable cursor sampling of data (see below).

Toggle 2 or 4-Panel Layout
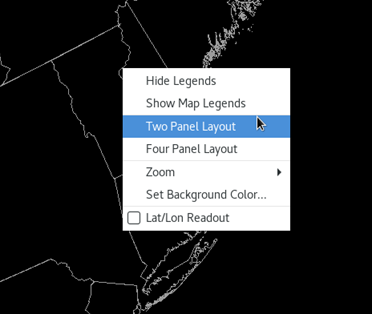
Right-click hold in the view and select Two Panel Layout or Four Panel Layout to create duplicates of the current view (note that any data loaded to the view will be loaded to both displays within the view).
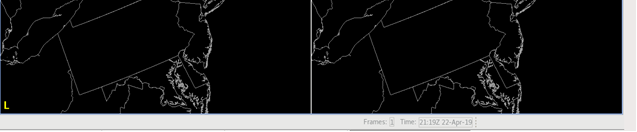
To load data to one of the panels, right click anywhere on the panel you want to load new data into, and click Load to this Panel. A yellow L will be displayed in the lower-left corner of the panel that is now ready to load new data.
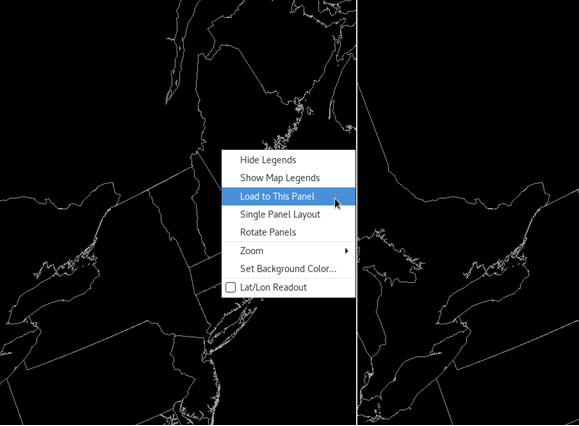
From this multi-pane display, hold-right-click again and you will see the Single Panel Layout option to switch back to a standard view (defaulting to the left of two, and top-left of four).
Sample Loaded Resources
Most data types have a right-click menu option for reading out the pixel value, displayed as multi-line text for multiple resources.

Hold-Right-Click Resource Name for Menu
Drag the mouse over a loaded resource and hold the right mouse button until a menu appears (simply clicking the resource with the right mouse button will toggle its visibility).
The hold-right-click menu allows you to control individual resource Image Properties, Change Colormaps, change resource color, width, density, and magnification, move resources up and down in the stack, as well as configure custom options with other interactive resources.

Time Match Basis
Often, when displaying a loop of multiple resources in the resource stack, the update frequency is different for each product (for example, satellite images using a mesoscale sector are updated every minute, but the METAR surface plots are only updated every 20 minutes). AWIPS uses what is called “time match basis” to handle this. The time match basis of a product changes which loaded set of data controls the update frequency of all data sets loaded in a current CAVE window. To determine which data set is selected as the current time match basis, look at the legend in the lower right-hand corner. The data set with an asterisk next to the product name in the resource stack is the current product set as the time match basis.

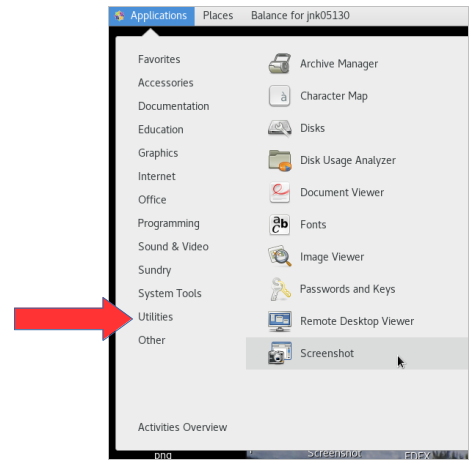
How to take a screenshot in Linux
Click on the Applications menu, then Utilities, and select Screenshot. The screenshot window options, with self-explanatory options. You can save the image file wherever you’d like.
Additional Resources
There are several excellent online manuals to get started with AWIPS CAVE, all including screenshots:
- Unidata’s CAVE User Manual: http://unidata.github.io/awips2/cave/d2d-perspective/
- NOAA VLab AWIPS Fundamentals: https://vlab.ncep.noaa.gov/web/oclo/awipsfundamentals
- Official AWIPS CAVE-D2D User’s Manual: https://collaborate2.nws.noaa.gov/partners/17.1.1/docs/UM/toc.htm
- UWM AWIPS-II Introduction and User’s Guide: http://tinyurl.com/UWM-AWIPSII-Intro-User-Guide