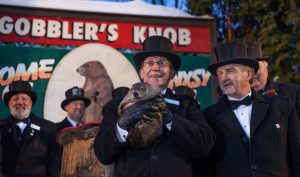
Every February 2, thousands gather at Gobbler’s Knob in Punxsutawney, Pennsylvania, to see the spring forecast from a special groundhog. In 2018, Punxsutawney Phil saw his shadow. We have six more weeks of winter!
Groundhog Day History
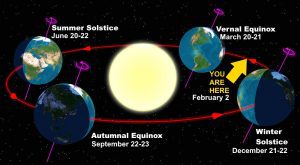
During the Middle Ages, various Europeans thought that animals hibernating underground such as the hedgehog and badger came to the surface on February 2. According to the Punxsutawney Groundhog Club, the observance may have its roots in Candlemas Day, which is also on February 2. Candlemas marks the halfway point between the winter solstice in December and the spring (vernal) equinox in March.
In Germany, it was thought that if the hedgehog saw its shadow it became frightened and crawled back to sleep during six more weeks of bad weather above ground. But if skies were cloudy, the animal ventured out and stayed above ground. When Germans emigrated to America, they transferred their belief to the animal most closely resembling the badger — the groundhog.
Predicting the Arrival of Spring is Difficult
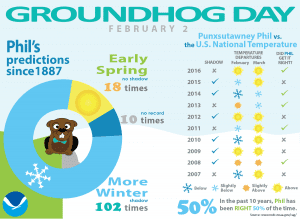
Since at least the 1970s, as the New York Times reported, the groundhog’s predictive skill has been called “dubious” by the Audubon Society, and by the late Eric Sloane as “a full‐fledged F”, when ranking groundhog predictions on a scale from T (True) to P (Possible) to F (False). The most recent years of an analysis by NOAA’s National Centers for Environmental Information (NCEI) shows no accuracy for the groundhog’s predictive skill. From 2007-2016, Punxsutawney Phil has been right 50% of the time:
Warmer Temperatures Typically Observed after Groundhog Day
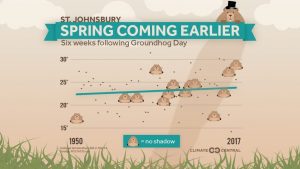
While the groundhog doesn’t exhibit predictive skill on Groundhog Day, we do know that most locations in the U.S. show observed warming trends for the 6 weeks after Groundhog Day. Climate Central examined the trend in the temperature by determing the average temperature from February 2 through March 16 from the Applied Climate Information System at www.rcc-acis.org. They found most locations across the U.S. showed an increasing temperature trend since 1950.
For example, in St. Johnsbury, Vermont, there has been an increasing average temperature trend from February 2 to March 16.
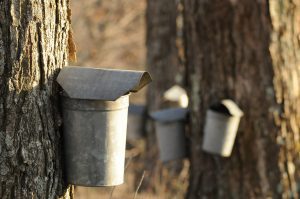
Earlier spring may sound nice at first, but it comes with an increased risk to agriculture. In Vermont, this is particularly applicable to maple syrup (Vermont has the highest percentage of tapped maple trees in the U.S.) As Climate Central notes, “maple syrup production is intimately tied to the weather. Sap only flows when temperatures rise above freezing during the day and drop below it during the night. That temperature difference creates enough pressure to push sap out of the tree — one of nature’s amazing feats.” Timothy Perkins, the director of the University of Vermont’s Proctor Maple Research Center, says, “in general over New York and New England, the [maple sugaring] season is now beginning about seven days earlier than it did 40-50 years ago and ending 10 days earlier.”