Dr. Geoffrey Stano is part of NASA’s Short-term Prediction Research and Transition Center (SPoRT). He has been involved with the GOES-R Proving Ground since 2009, and in 2016 began serving as the Satellite Liaison for the Geostationary Lightning Mapper (GLM). His role has been to support the National Weather Service in preparing for the GLM. This has been done through webinars, training sessions, and the development of training modules for the forecasters. This seminar will provide a short background on the NASA SPoRT program as well as the GLM instrument. The remainder of the presentation will focus on real-world applications of the GLM data as it is being integrated into the National Weather Service.
Dr. Geoffrey Stano
Dr. Stano has focused on operational applications research, specifically with lightning observations, for the past 15 years. This has included work with ground-based lightning mapping arrays to the first of its kind Geostationary Lightning Mapper aboard the new GOES-R series. In addition to his role as a lightning expert and trainer with the NASA SPoRT center, he currently serves as the chair for the American Meteorological Society’s Atmospheric Electricity Scientific and Technological Activities Commission.
Atmospheric rivers are relatively long, narrow areas of moisture transport. They’re responsible for approximately 90% of meridional water vapor transport, and also for many high impact rainfall events. This presentation will provide an overview of the structure, climatology, and impacts of atmospheric river events. Predictability and forecast tools will also be discussed.
Dr. Greg West is a Research Associate in the Weather Forecast Research Team at the University of British Columbia in Vancouver, BC. Research projects he is involved with center around improving weather forecasts for clean energy production for the province’s primary electric utility, BC Hydro. This primarily includes improvement of probabilistic forecast post-processing via machine learning methods, evaluation of forecasts, and creation of innovative new forecast tools such as situational awareness forecast indices.
Dr. Stephanie Spera’s research seeks to understand landscape-level human-environment feedbacks with regard to social, economic, and environmental drivers and consequences. She is currently a Postdoctoral Researcher at Dartmouth College. She analyzes large datasets, develops algorithms, and integrates spatial data to characterize landscapes and landscape-scale dynamics. Broadly, she asks, ‘How do we ensure that we manage our landscapes sustainably?’ She is interested in how and to what extent humans are modifying the landscape; what is driving changes in land cover; how these changes are affecting the environment; and how humans are, in turn, responding to these changes. She uses different methods and tools, like remote-sensing, regional climate models, spatial statistics, and GIS, to help answer these questions. Her most recent work focuses on answering these questions focusing on agricultural land-use change and regional climate dynamics in the Brazilian Cerrado, a biodiversity hotspot and agricultural breadbasket.
Have you ever wanted to be an aviation meteorologist?
In this seminar, Erin Rinehart talks about her journey to becoming the primary night shift meteorologist at Southwest Airlines in Dallas, Texas. She attended Baylor University where she earned a B.A. in Earth Science. After college Erin joined the U.S. Air Force as a weather forecaster where she served for eight years. Following military service, she enrolled in the M.S. in Applied Meteorology program at Plymouth State University. After a short time working as an aviation forecaster contracted with American Airlines, she moved to Southwest Airlines. In this talk, Erin also discusses various aviation meteorology products used by both the military and civilian airlines, along with her various shift duties at Southwest Airlines. She also touches on some of the differences between airline aviation forecasts and the media forecasts created for the general public.
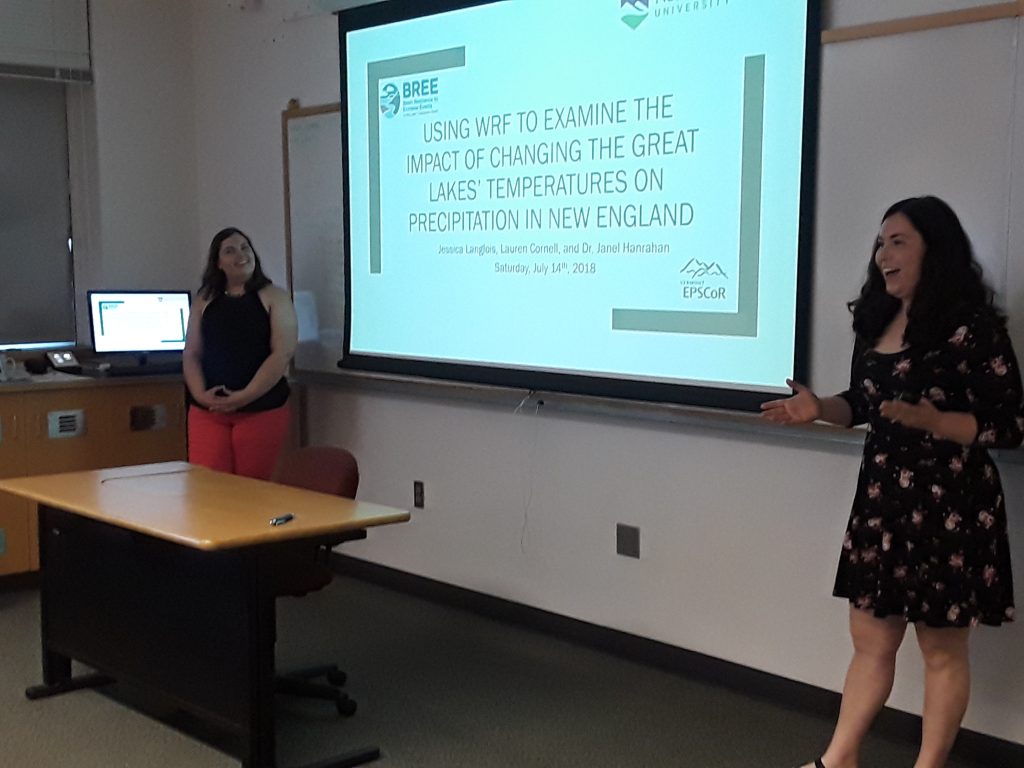
How do water temperature changes on the Great Lakes affect modeled downwind precipitation? Two Atmospheric Sciences students, Jess Langlois and Lauren Cornell, just completed their summer internship to answer that question. Over a seven-week period, they worked with Dr. Hanrahan to analyze simulated rainfall data obtained from the Weather Research and Forecasting (WRF) model. Several simulations were completed to assess the sensitivity of precipitation in New England to changing water temperatures of the Great Lakes. Their work will inform the configuration of the regional climate model which will be used to downscale future global climate model simulations under human-caused climate change. As members of the BREE (Basin Resilience to Extreme Events) Climate Modeling Team, Jess and Lauren presented their work at Plymouth State University and Dartmouth College. They also plan to present results at the American Geophysical Union Fall Meeting this upcoming December.
Jess and Lauren also practiced presenting their research to faculty and staff at Northern Vermont University-Lyndon:
Integration of renewable wind energy sources into the electric transmission grid has created new challenges for energy planners. Winds are highly variable and power generated by wind fluctuates with wind speed. Energy planners need to be able to anticipate these fluctuations to keep electricity supplied to the grid in sync with demand. Numerical weather prediction is key to effectively integrate wind resources, which supplies future estimates of wind power generation. Weather forecasts are used several hours to several days in advance to manage which generation sources will be used to supply power to the grid, which resources can be freed up to perform maintenance, and how much electricity is available to be traded on the market.
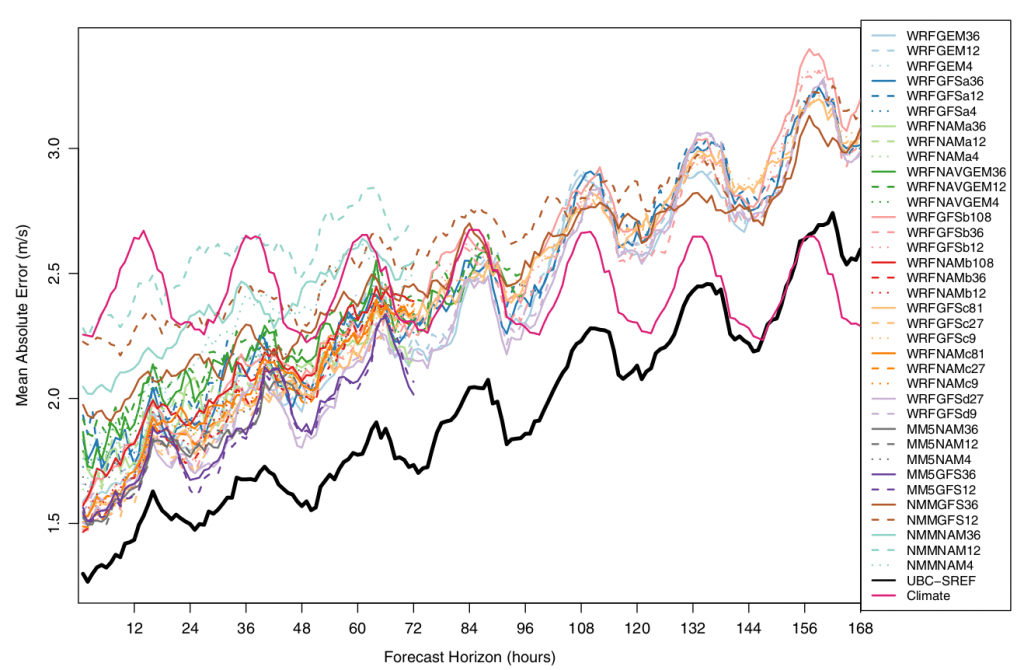
Weather forecasts, however, are imperfect due to incomplete initial conditions, assumptions in model physics, and the poor representation of terrain and complex flows. In the past, small reductions in forecast error have been shown to result in substantial annual savings to electric grid operators through optimized grid planning strategies. Dr. Siuta’s recent publication explains one method to achieve reduced forecast error through use of ensembles. He used a 36-member mesoscale ensemble forecast system run by the University of British Columbia to show that, on average, reductions in forecast error by using an ensemble mean forecast over a single-model forecast is between 10 and 20% through a seven-day forecast horizon. Additionally, the ensemble mean provided a minimum of an additional two days of forecast skill over the ensemble member forecasts when compared to a reference climatology forecast (see figure). In the same work, Dr. Siuta also shows a method to produce calibrated probabilistic forecasts and the effect of an ensemble on reducing forecast uncertainty.
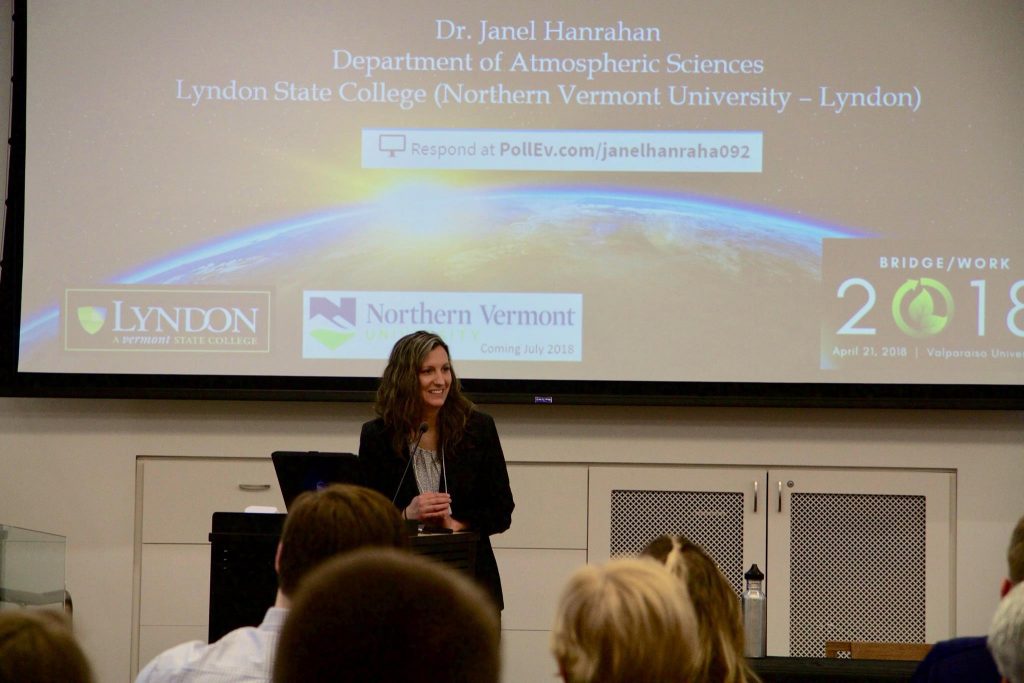
Dr. Janel Hanrahan was the keynote speaker for the Bridge/Work Conference at Valparaiso University in Indiana over the weekend. This year’s conference theme was Preserve and Prosper – Method and Morality in Facing Environmental Challenges. For this event, which is designed to connect theory and practice, Dr. Hanrahan gave the opening talk titled Starting the Climate Change Conversation: What we know and why we must act. She provided an overview of climate change science, discussed observed impacts, and explained how our climate system is likely to change in the near future. In addition, she shared the work of Lyndon’s Climate Change Communication Group and encouraged participants to educate others about climate change. Dr. Hanrahan’s talk was followed by student research presentations and expert panel discussions.
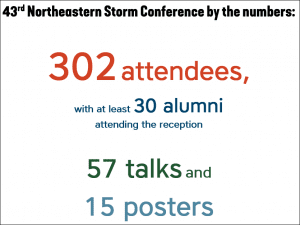
The 43rd Northeastern Storm Conference was held in Saratoga Springs, NY, on March 9-11, 2018. The Northeastern Storm Conference is an excellent opportunity for students, professors, scientists and other professionals to share and learn about the latest weather and climate research.
This year’s Friday evening speaker was Amanda Curran, ’14 from WSFA, and recently certified American Meteorological Society broadcast meteorologist.
Saturday’s banquet speaker was Rear Admiral for the US Navy (Retired) Dr. David W. Titley from Penn State, who is on the forefront of addressing climate change in naval operations and national security.
Sunday morning’s speaker was Kathryn Mozer, ’08, the GOES-R User Services Coordinator at NOAA.
Several Atmospheric Sciences students presented their research during the poster session.
Atmospheric Sciences Seminar Series
Thursday, February 22, 2018 12:30 PM, ASAC 319
Ever since Lord Chesterfield developed the first modern couch during The Restoration, generations of comfort seeking global citizens have taken advantage of its soothing support, interrupted only for work or the occasional trip to the loo. Now, as society accelerates into the Information Age, a new activity for exercise-challenged individuals presents a rare opportunity to advance science while indulging in spirits and burning less than 1 calorie per hour.
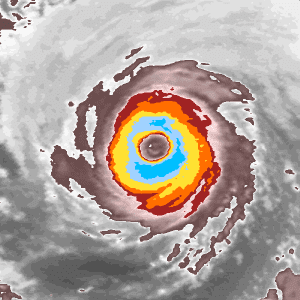
Inspired by the legions of couch potatoes who have explored the mysteries of the galaxies through the crowdsourcing website Galaxy Zoo, Cyclone Center was introduced to the world in September of 2012. Harnessing the pent-up energy of Netflix binge-watchers everywhere, Cyclone Center uses crowdsourcing to generate unique data used to determine the intensity of any tropical cyclone. Cyclone Center output brings order to the chaotic scene of global tropical cyclone intensity records, where individual forecast agencies desperately grope around in the darkness for ground truth data that do not exist.
Dr. Christopher C. Hennon
Dr. Chris Hennon is a Professor and Chair of the Department of Atmospheric Sciences at the University of North Carolina at Asheville. Before beginning his position there in 2005, he was a Post-Doctoral Fellow and Visiting Scientist at the National Hurricane Center in Miami, FL where he conducted research on evaluating the impact of scatterometer winds on marine and tropical cyclone forecast skill. Dr. Hennon earned his B.S. in Aeronautics/Mathematics from Miami University (OH) in 1994, his M.S. in Atmospheric Science from Purdue University (1996), and his Ph.D. from The Ohio State University (2003). He was born and raised near Cleveland, OH and maintains his allegiance to the Cleveland Browns to this day. Dr. Hennon is married to another meteorologist but their 15-year old daughter has no interest in weather and just uses her phone all day.
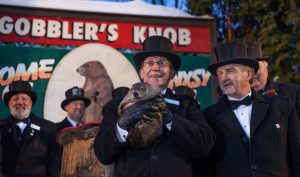
Every February 2, thousands gather at Gobbler’s Knob in Punxsutawney, Pennsylvania, to see the spring forecast from a special groundhog. In 2018, Punxsutawney Phil saw his shadow. We have six more weeks of winter!
Groundhog Day History
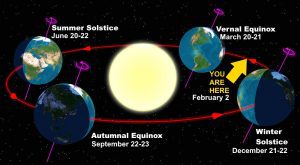
During the Middle Ages, various Europeans thought that animals hibernating underground such as the hedgehog and badger came to the surface on February 2. According to the Punxsutawney Groundhog Club, the observance may have its roots in Candlemas Day, which is also on February 2. Candlemas marks the halfway point between the winter solstice in December and the spring (vernal) equinox in March.
Earth’s orbit. February 2 lies halfway between the Winter Solstice and the Vernal (Spring) Equinox.
In Germany, it was thought that if the hedgehog saw its shadow it became frightened and crawled back to sleep during six more weeks of bad weather above ground. But if skies were cloudy, the animal ventured out and stayed above ground. When Germans emigrated to America, they transferred their belief to the animal most closely resembling the badger — the groundhog.
Predicting the Arrival of Spring is Difficult
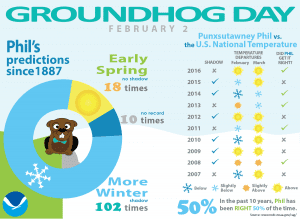
Since at least the 1970s, as the New York Times reported, the groundhog’s predictive skill has been called “dubious” by the Audubon Society, and by the late Eric Sloane as “a full‐fledged F”, when ranking groundhog predictions on a scale from T (True) to P (Possible) to F (False). The most recent years of an analysis by NOAA’s National Centers for Environmental Information (NCEI) shows no accuracy for the groundhog’s predictive skill. From 2007-2016, Punxsutawney Phil has been right 50% of the time:
Verification of Punxsutawney Phil’s prediction and the observed
Warmer Temperatures Typically Observed after Groundhog Day
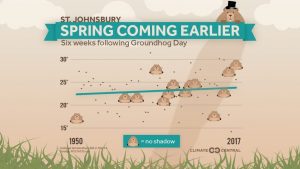
While the groundhog doesn’t exhibit predictive skill on Groundhog Day, we do know that most locations in the U.S. show observed warming trends for the 6 weeks after Groundhog Day. Climate Central examined the trend in the temperature by determing the average temperature from February 2 through March 16 from the Applied Climate Information System at www.rcc-acis.org. They found most locations across the U.S. showed an increasing temperature trend since 1950.
For example, in St. Johnsbury, Vermont, there has been an increasing average temperature trend from February 2 to March 16.
the very warm February.
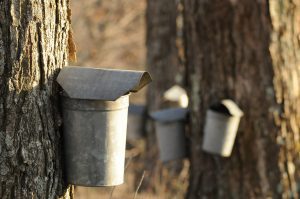
Earlier spring may sound nice at first, but it comes with an increased risk to agriculture. In Vermont, this is particularly applicable to maple syrup (Vermont has the highest percentage of tapped maple trees in the U.S.) As Climate Central notes, “maple syrup production is intimately tied to the weather. Sap only flows when temperatures rise above freezing during the day and drop below it during the night. That temperature difference creates enough pressure to push sap out of the tree — one of nature’s amazing feats.” Timothy Perkins, the director of the University of Vermont’s Proctor Maple Research Center, says, “in general over New York and New England, the [maple sugaring] season is now beginning about seven days earlier than it did 40-50 years ago and ending 10 days earlier.”

 Dr. Christopher C. Hennon